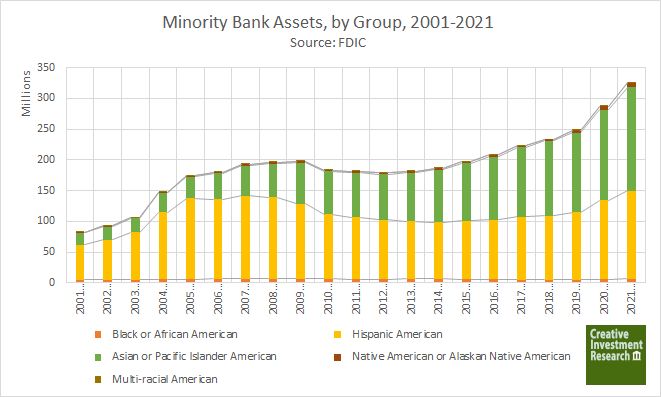
The chart above shows minority bank assets by ethnic group, by year from 2001 to 2021. It details Hispanic bank assets falling relative to Asian bank assets starting in 2005.
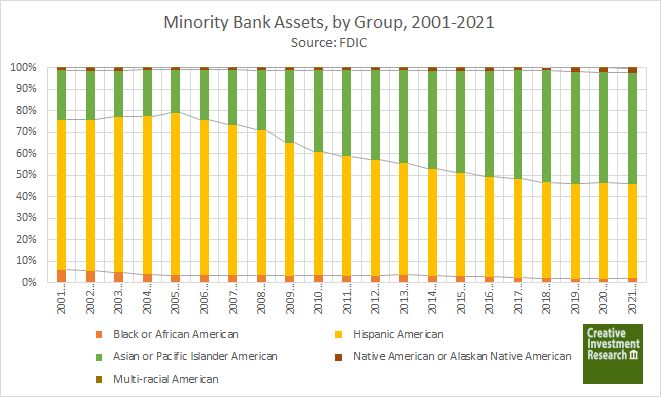
The chart above shows minority bank assets as a percentage of 100% by year from 2001 to 2021. It shows a decline in Hispanic bank assets starting in 2005, most likely due to the impact of restrictions on immigration placed by the Bush Administration. The 2008 financial crisis and the impact of Obama Administration policies also slowed Hispanic bank asset growth, This also served to elevate the relative growth of Asian bank assets.
Full detail concerning these factors are outlined in our Mid-Year 2022 Minority Bank and Thrift Review. To purchase this report, email info@creativeinvest.com.